These are the lecture notes for FAU’s YouTube Lecture “Medical Engineering“. This is a full transcript of the lecture video & matching slides. We hope, you enjoy this as much as the videos. Of course, this transcript was created with deep learning techniques largely automatically and only minor manual modifications were performed. Try it yourself! If you spot mistakes, please let us know!
Welcome back to Medical Engineering. Today we want to continue talking about microscopes and in particular, we want to talk about the contrast mechanisms in microscopes. This is what we’ll do in the next couple of minutes so looking forward to discussing the contrast mechanisms in microscopy.
So here we are back in our lecture on medical engineering and today we talk about the contrast mechanisms and the first one we want to look at is bright field microscopy.
So what does brightfield microscopy mean? well, that’s actually the simplest light microscopy technique and due to its simplicity, it’s cheap and thus widely used in biology. The acquired image is interpreted as light absorption. So essentially the energy that is lost when passing through the sample and therefore the background tends to be bright because we illuminate from the other side of the object. Then we irradiate through the object. So this might be a small piece of glass and there the actual thin slice let’s say a histology image is located in there and the background is bright. So this leads to the name of bright field microscopy.
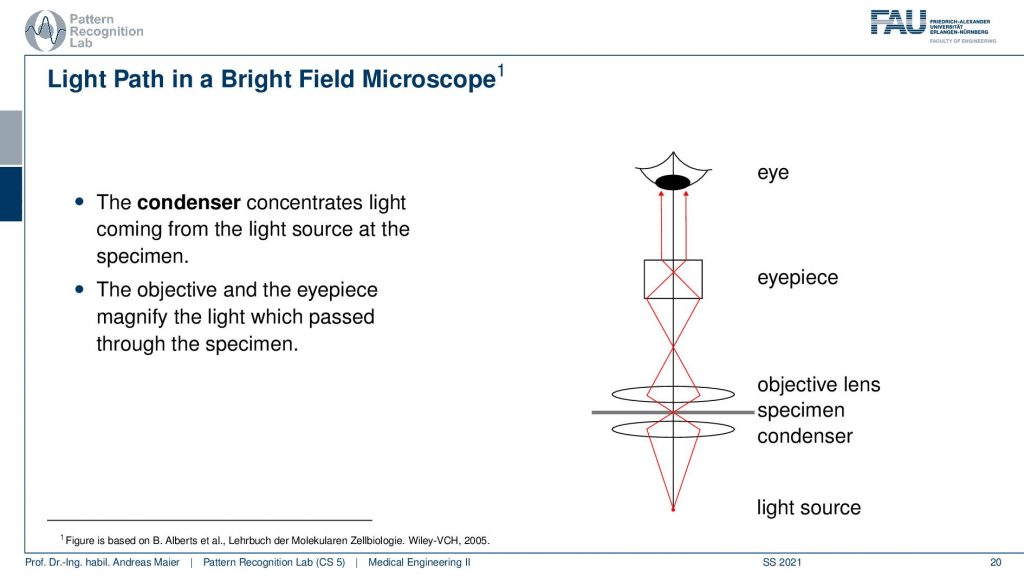
Now if you do that this is the typical setup. So you have essentially a condenser that concentrates the light coming from the source at the specimen. Then you go through the specimen into the objective lens. This is essentially where the compound microscopy magnification mechanism actually starts that we discussed in the last video. Then we have the eyepiece and then we have the eye that is looking at this virtual image that is generated there. So the objective and the eyepiece magnify the light which is passed through the specimen and this allows us to look at the image. I do have an example here.
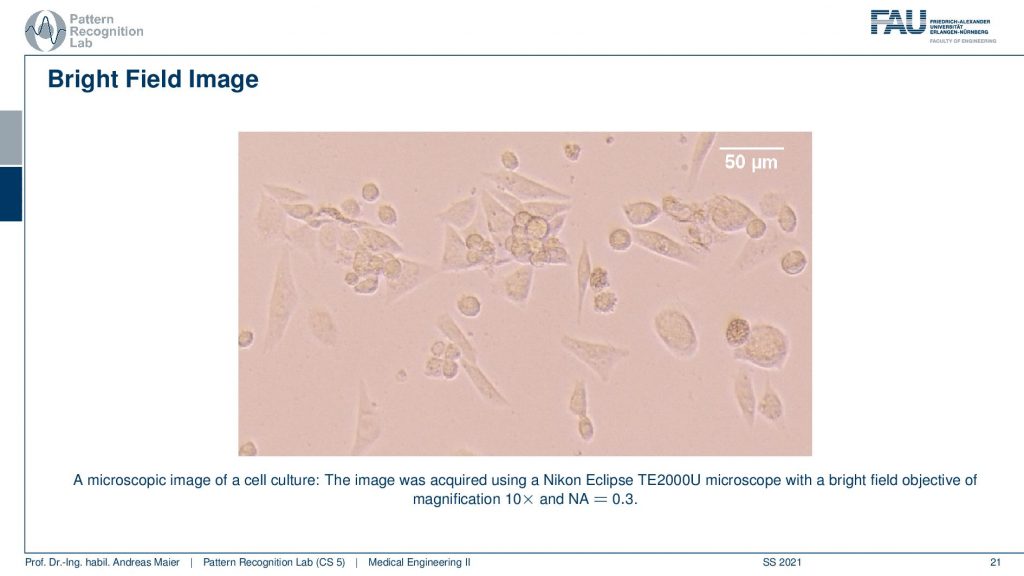
So these are bright-field images of cell culture. So this is actually acquired with a Nikon eclipse microscope and this is showing us CHO cells so the Chinese Hamster Over results, a very common kind of cell that is used in experiments. You can see that they have different shapes and we can try to figure out what’s going on in those cells. You see indicated on the top right that we have this white bar indicating 50 micrometers of distance within the image dimensions. So you see we are already pretty small here and a cell these are rather big. So you have maybe 20 micrometers in diameter of those cells. Well, what else?
We have fluorescent microscopy.
Now in fluorescence microscopy again we use essentially a brightfield microscope. But what we now want to do is we want to use the fluorescence effects that give us the signal. So this is another phenomenon that can be indicated by using particular light in order to start a resonance of a particular contrast agent, for example, to produce a specific light characteristic. Then we image this fluorescence effect. So here we use some special materials and when they are illuminated they resonate at a specific wavelength and emit another wavelength. So we can this way convert one light into another light and this only occurs at a specific light frequency. This allows us then to differentiate different materials, for example, contrast agents that have been used in the specimen and you can for example use traces of that.
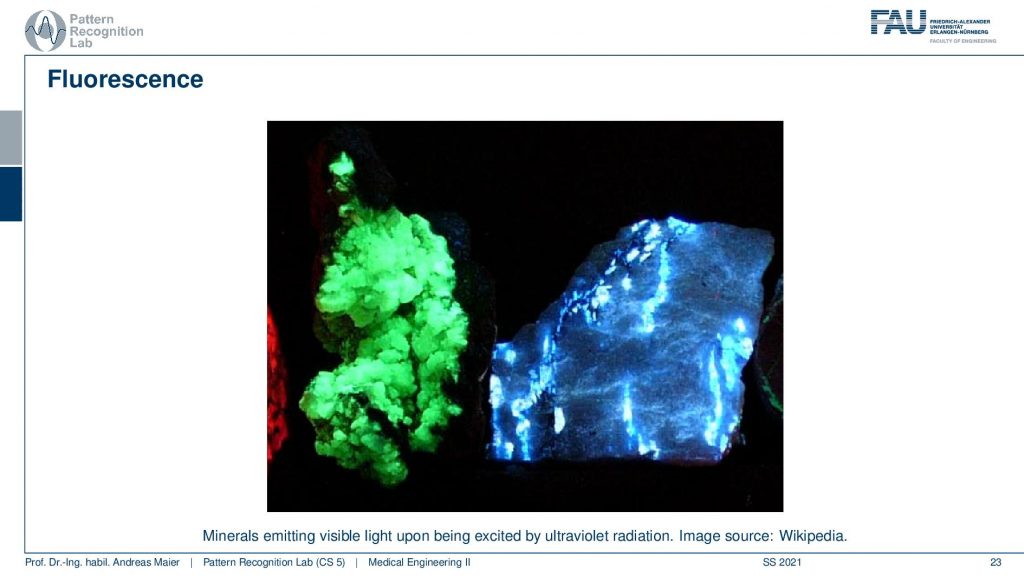
So here we have an example for this fluorescence effect. Here are minerals and they are essentially emitting light when they are excited by ultraviolet radiation. You see that depending on the material they resonate at different frequencies so they have different colors and we can use this fluorescence in order to build a specific marker.
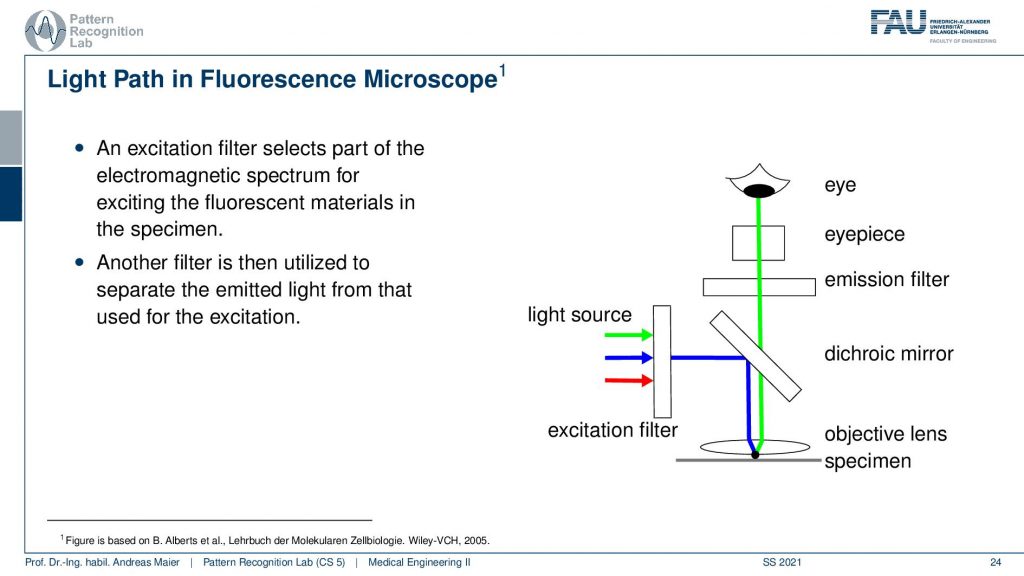
So the idea now in this light path is that we have an excitation filter that selects the electromagnetic spectrum for exciting the fluorescent materials in the specimen. So we have a light source, we put a filter let’s say our ultraviolet light now is here displayed in blue and all the other light from the light source is filtered out. So only the ultraviolet light is remaining. Then we use a mirror and this is a special mirror that reacts differently for different wavelengths. So the ultraviolet light is reflected into the objective lens and then onward into the specimen. In the specimen, it interacts with the materials that have this fluorescence effect. Now only the materials that resonate in fluorescence then emit another light. Let’s say it’s green here in this example and then we follow the green path where we go again through the objective lens it’s not altered by our mirror. So we each can just pass through the mirror; we don’t care about that. Then we have maybe another emission filter and the eyepiece and then we can look at the fluorescence effect of the eye. So this is the general setup. Of course, we have also an additional filter that can be used in the eyepiece which is allowing us to only focus on the wavelengths that are in the range of the fluorescence effect.
So this can be used as it delivers a very high contrast when compared to bright field images. But the fluorescence effect has to be associated with a material. So it can cause additional biological and physical processes. So we end up with something that is called the observer’s paradox. If we use this effect then we can, of course, see certain things but we are not sure whether these things are really happening or whether they are related to our fluorescent dye that we’re using. There are many different applications of course for fluorescence microscopy but whenever you use such a dye you have to be very sure that you’re not influencing the actual biological processes that are underlying. Maybe your dye is poisonous and it will then cause the cells to behave in a certain way as they wouldn’t if you hadn’t used the dye. So this is a kind of a problem but by now these effects are studied very well and you can find it in literature. One example where this is very commonly used is Cell Viability Detection.
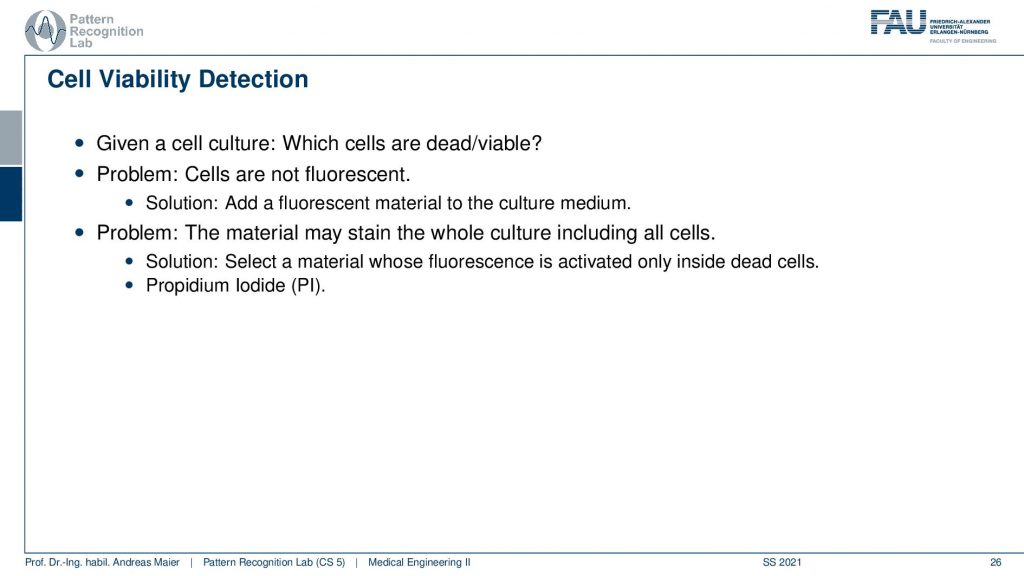
So here we can use dye to figure out whether a cell is still alive or not alive. So we can use it as a kind of functional contrast in a microscopic image. So let’s say we have a cell culture and we want to figure out which cells are dead and which cells are alive. Then by default typically cells are not fluorescent. So we have to do something about that. So we can add a fluorescent material to the culture medium. Then we have to know how the culture medium and also the cells deal with that particular material in order to understand the visual effect. One problem that could emerge is that the stain may just affect all of the cells including the living cells and the dead cells then you wouldn’t be able to use that. So you need to have a material that is activated only inside that cells. This can be done with Propidium Iodine(PI). So Propidium Iodine is a special die or marker and if you use it then you can then take two images.
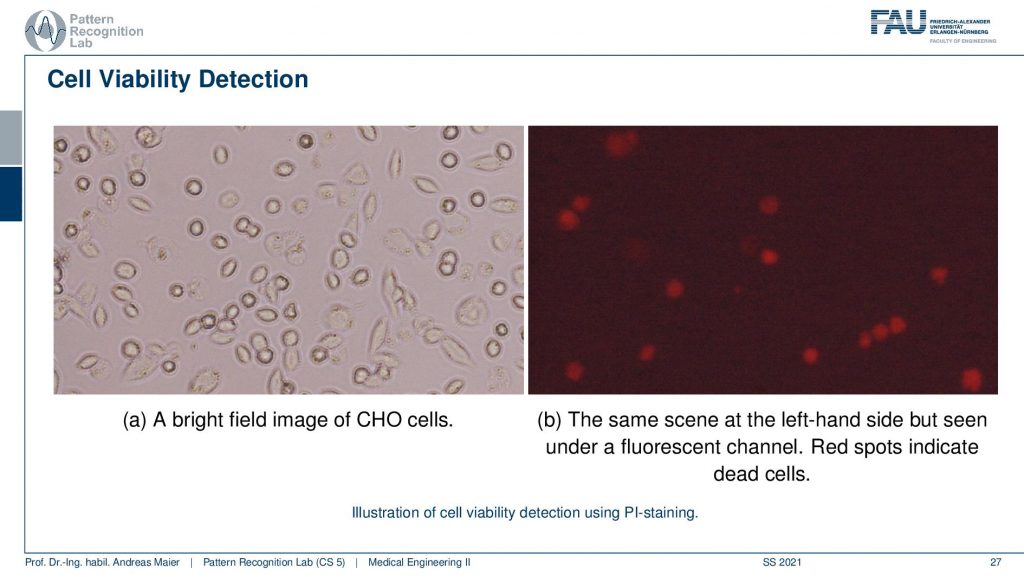
Interestingly we can take the same microscope because the fluorescence effect is just added on top as you’ve seen in the previous examples. So we can take the same microscope to produce a bright light field image. Here you see the Chinese Hamster Ovary cells again but we can’t figure out whether they are actually alive or dead. Now we add the PI dye and we can then illuminate this whole scene and use the fluorescence effect. Then we see the red dots here on the right-hand side and the red dots on the right-hand side they show only the dead cells. So this is a marker for dead cells and this allows us to determine whether the cells have been essentially killed by environmental effects or by any other effects that are somehow affecting our cells.
The idea here is then that the viable cells are usually selectively permeable. So they do not allow molecules to freely cross the cellular membrane. When the cell dies this exclusion property is lost and our contrast agent can actually enter the cell. Then it will be included inside of the cellular membrane. In fact, it even gets enriched within the cell. This is why we get this strong glowing effect for the cells that have been marked. So the contrast agent binds then into the RNA and DNA because this is how we constructed actually our marker and it stays inside the penetrated cell and then drastically enhances the fluorescence. It’s a factor of 20 to 30 fold and it stays in there because it is actively binding to RNA and DNA inside of the cell. Now we can see that the viable cells the cells that are still alive they are not penetrated by our marker and they remain unstained. So with this kind of staining system, I can then figure out which cells are alive and which ones are dead. So that’s also a pretty cool approach that involves a lot of biology and of course, we now know because this dye has already been researched on. You can of course also think about that that developing dyes for specific biological and molecular phenomena is a very active field of research.
There’s a couple of disadvantages. Staining, of course, may cause undesired effects of the observer’s paradox that I already talked about and this may hamper the results of our study. What we see under the fluorescence microscopy is the activity of the fluorescent dye which in general does not reveal structural information anymore. So we only see how much of the dye is actually in that particular cell. But we see nothing else because only the dye is actually activated by our fluorescence effect. So we only see the fluorescent material in this case.
Let’s move on to another contrast mechanism and this is the so-called phase-contrast microscopy.
So you remember light can be interpreted as a wave and there is the amplitude which essentially the height. The other part is the phase so this is essentially how far the sign has been shifted since it originated from the source. So this is the idea that we want to use here for the contrast mechanism. You can then also image objects that are essentially transparent. Because a transparent object doesn’t reduce the amplitude. It has almost no absorption than the surrounding media and therefore we can’t see it. So that would be bad because an ideal transparent object doesn’t absorb any light and thus it would never be able to be seen on a bright-field microscopy image. Well, the good news is that even though it is transparent it may change the phase of the light. Because the light has to enter and leave the object and there might be changes indicating a change in phase and this is then also called a phase object and this would alter the face of the light.
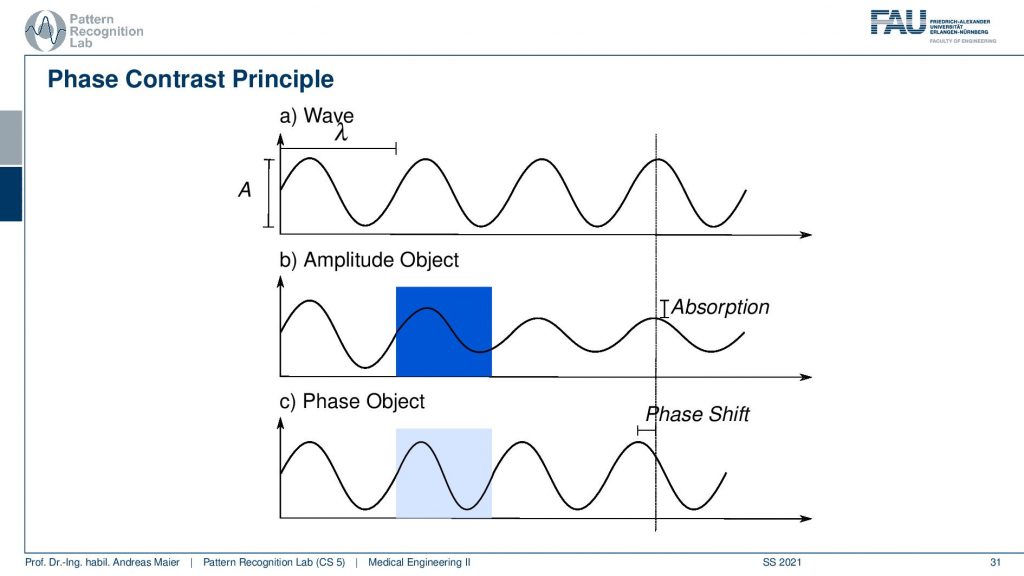
So let’s have a short review of what we mean with the phase and the amplitude. Here we have two different kinds of objects. We have a wave that just propagates from the medium. So this is at a wavelength of λ. So it has a fixed color or fixed energy here and you can see that our amplitude object results in a reduction of the amplitude of the wave. So we enter the object and from the beginning of the object to the end of the object we see a gradual reduction of the amplitude of the wave. Afterward, we propagate through our empty media so there is no change in amplitude anymore. But at the detector that is indicated here with the line on the right-hand side, we see a difference in absorption. The difference in absorption is essentially the bright field microscopy effect that we can image. Now in a phase object, there is no change in amplitude as you can see in c here. So we never have a change in amplitude but we might have a different propagation speed in our phase object because it’s consisting of a different material. Because of that, we have a shift in phase. So you see that as soon as we leave the object we have a different configuration of the wave. So the location of the maximum is shifted and this is a difference in phase. So the phase contrast is caused by a shift in phase in our lightwave and it’s not associated with any change in amplitude. So that’s a very important effect and we’ll see that we can use this effect in many different measurements not only concerning visible light but it’s also relevant for x-rays for example.
Now this effect can be used for imaging. But the problem is that the physical devices that we’re using for measurement, use the amplitude. So they essentially compute the energy of the incident light and this is the amplitude squared. So we are not able to detect that with a classical detection system. There was this brilliant idea by Zernike. Zernike in the early 1930s used a filter to convert the phase change into an amplitude change. This is a very interesting idea and now we will have a short look into the idea of what this filter does.
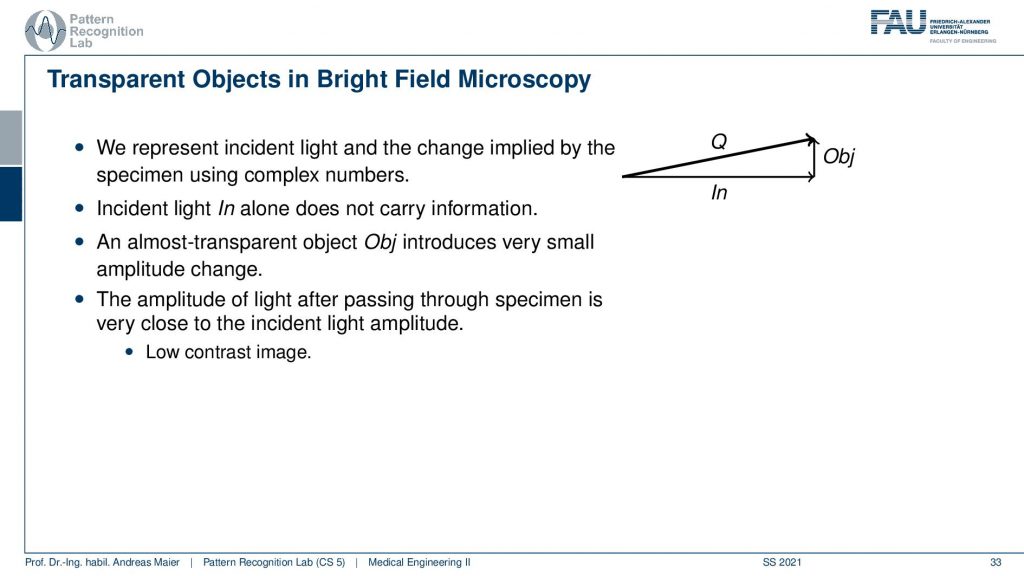
We now represent the light and the phase as a two-dimensional vector. You can see here that we describe it using complex numbers. We have the incident light here and it doesn’t carry any information. As soon as it goes through the object we see that it is altered in a way that the face is shifted. So we kind of move in a direction that is not measurable. This direction is essentially perpendicular to the incident light. The global amplitude is essentially not changed by a lot because we still have almost the same amplitude after passing through the specimen. This means that we have a very low contrast image. So there is a slight change in amplitude here but it’s not visible for our system here. Because the difference is just too low because we only measure effects that are going along the x-axis. So we’re not measuring anything that’s going along the y-axis in this figure. You see the difference along the x-axis is neglectable. There’s no difference. So the entire arrow is longer but as soon as we project it back on the x-axis there’s no difference anymore. So we have a low contrast image.
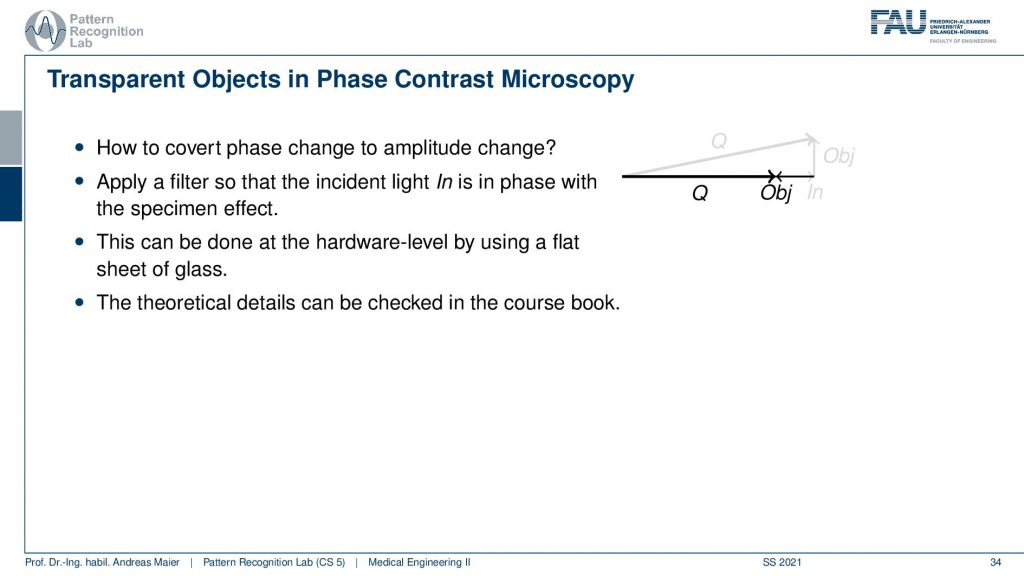
Now how can we still measure this? The idea is that we use this filter that changes the phase into an amplitude change. So this essentially then rotates our object effect into our x-direction. Here you can see now by using this filter we suddenly have an effect that will be measurable in the x-direction because we rotate the effect of the object into the amplitude domain. This is done by hardware level, for example, this filter is not a convolutional something that you might be thinking about from signal processing but it’s really hardware that is entered into the microscope and this can produce this effect. The theoretical details about this you can find in the coursebook.
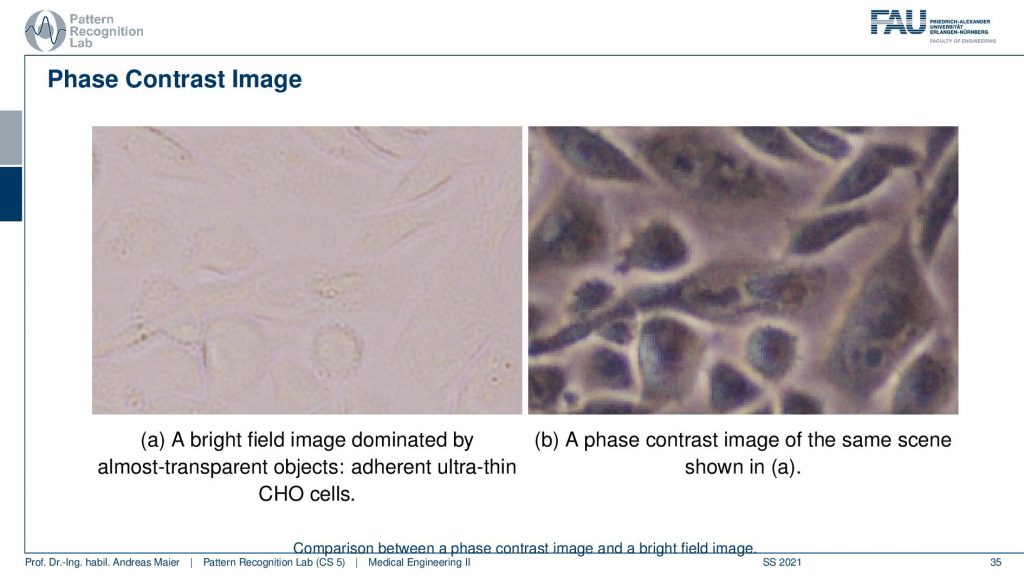
Let’s have a look at how this looks like. Here you see our good friends the Chinese hamster ovary cells on the bright field microscope on the left-hand side. On the right-hand side, you see the face contrast image. While they are almost invisible on the left-hand side we have very good contrast on the right-hand side. Because we use this trick with projecting the phase information into the actual amplitude domain and suddenly we can see invisible stuff. So that’s pretty cool!
Well, let’s talk a bit about the limitations of light microscopy.
One particular effect is that we can combine lenses. But what have we seen so far we could think we can just do this until infinity right? So we can have infinite magnification. This is just the product of lens magnifications and then we can do magnification after magnification and we will never have any trouble with that. Unfortunately, that’s not the case. Because the image is actually the image of a point and this is not exactly correct because a point would be infinitely small. But as we’ll see that there are actually limits on the useful magnification. You could still magnify but all you would get is blurred information. So you would actually not get sharp and usable information. So there’s a limit to the use. So you can build microscopes that do a lot of magnification but you won’t see more than in a microscope that is essentially oriented on the physical limits of light. We’ll see that in the next example.
So this is called an Airy disc. As light expresses this wave-like nature it suffers from diffraction. Due to diffraction, the image of a point source is not infinitely small even at the best focus. This is then resulting in the so-called airy pattern you see here on the right-hand side and it is composed of a central spot. This is known as the Airy disk. So this is the white part in the center and it’s surrounded by multiple diffraction rings. The radius of this Airy disk that is given here is the dAiry is dependent on a wavelength and the numerical aperture. So it’s very very hardly constrained by the setup of your microscope. So λ you can change in terms of the light that you’re using so this is essentially the color of the light that you’re using. The numerical aperture as we have seen in the last video is determined by the geometry of the system. We know that the highest values of the numerical aperture that we can obtain and that would shrink now the radius of this airy disk would be approximately 1.5. So you see that the diameter of this Airy disk is mostly governed by the wavelength that we are using. So we can do a couple of tricks with embedding medium and so on to get some additional resolution. But there are limits to that as we’ve seen.
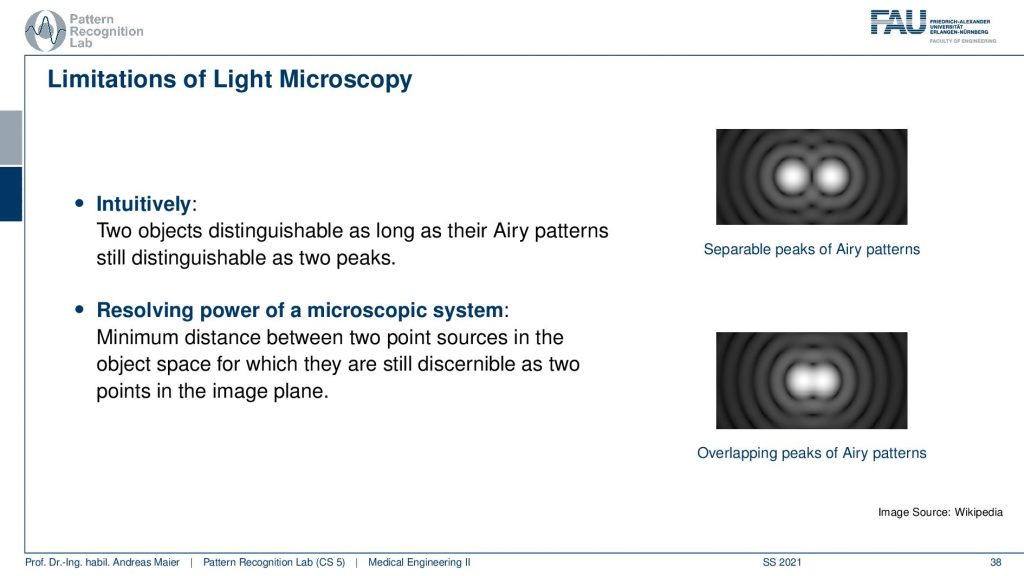
So intuitively two objects are distinguishable if there are outside of the radius of the area patterns. So if I have two peaks and the distance between them is larger than an Airy pattern then we can still differentiate them. Then if we move them together you see that they start joining. There is a limit to a minimum distance between the two-point sources such that they can still be perceived as two different spots. This is exactly given by the Airy pattern.
So according to Rayleigh, this is the minimal distance that can be distinguished as exactly the Airy pattern disk radius. You can see that we can compute this as 0.61 times the wavelength divided by the numerical aperture. This way you see that there is a limit to the resolution. Well, how could we increase this resolution? Well, we could increase the numerical aperture. We see here that the numerical aperture has an upper limit of 1 in the air because n is approximately 1 and of course the sine can also be maximally 1. We can stretch this a little bit if you use the oil immersion and then we would have a slightly better resolution than in our setup in just air. Well and then of course you could use shorter wavelengths and this means you need higher energy light. This leads then to very different fields like x-ray microscopy and then different effects that can be exploited to get larger magnifications.
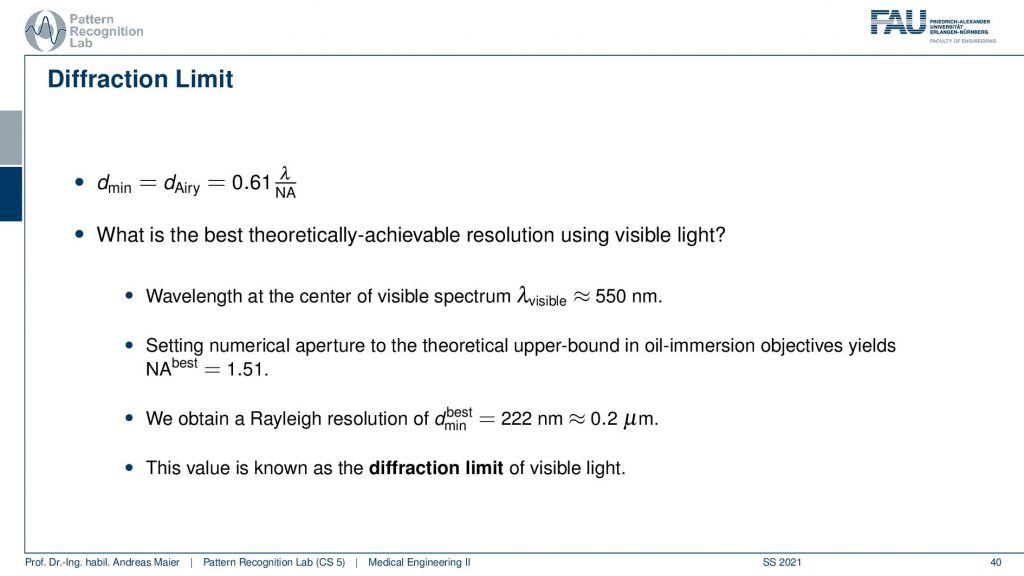
So here we see now the minimum distance can be computed from the wavelength. So what is the best theoretically achievable resolution using visible light? Well, the wavelength at the center of the spectrum is approximately 550 nanometers. So we use the best numerical aperture that we can get this is the 1.51. This means that we obtain a rayleigh resolution of approximately 0.2 micrometers. So with visible light, you will approximately yield 0.2-micrometer resolution and you can’t get better with that. This is known as the diffraction limit of visible light.
So can we go beyond this?
Oh yes! we can go beyond it. One obvious way is decreasing the wavelength.
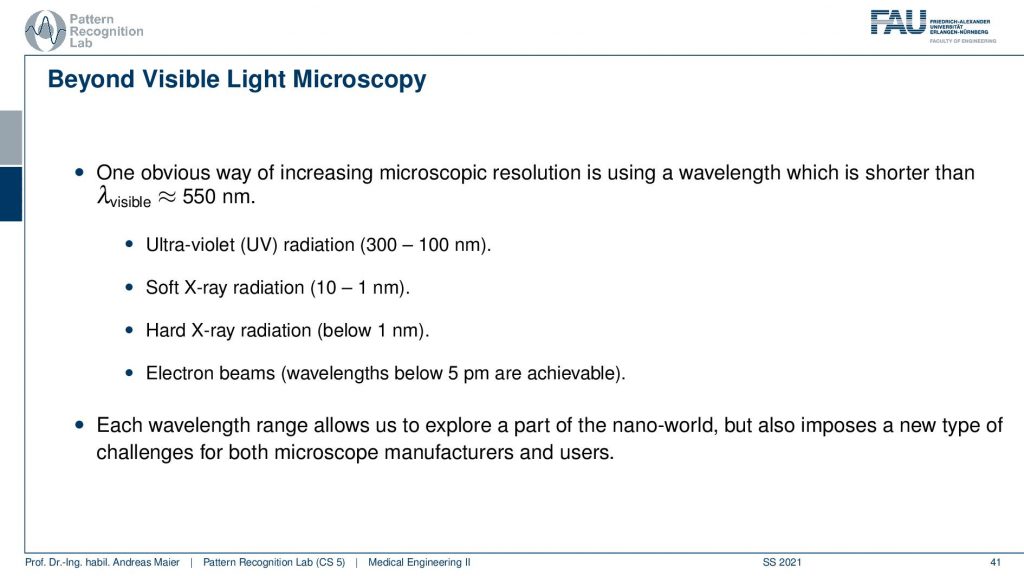
So you can do ultraviolet soft x-ray hard x-ray or even electron beams where we can even get into the range of approximately five picometers that are achievable. But then you have to deal with electrons we have very different optics, very different devices but with this, in electron microscopy, you can yield even larger magnifications to what we’ve seen here in the light-based kind of approach that we have discussed in most parts of this lecture. So each wavelength range allows us to explore a different part of the nanoworld but also imposes a new type of challenge for both the microscope manufacturers as well as the users. Imagine you want to work with electron beams then you have to use a vacuum so you can’t image anything that’s living anymore and also x-rays have strong effects on living tissues. So they will also very quickly break down the DNAs and kill the tissue that is actually under investigation. So that’s a really hard part and here we have a problem with the magnification of this achievable. Very well what’s the problem with short wavelengths?
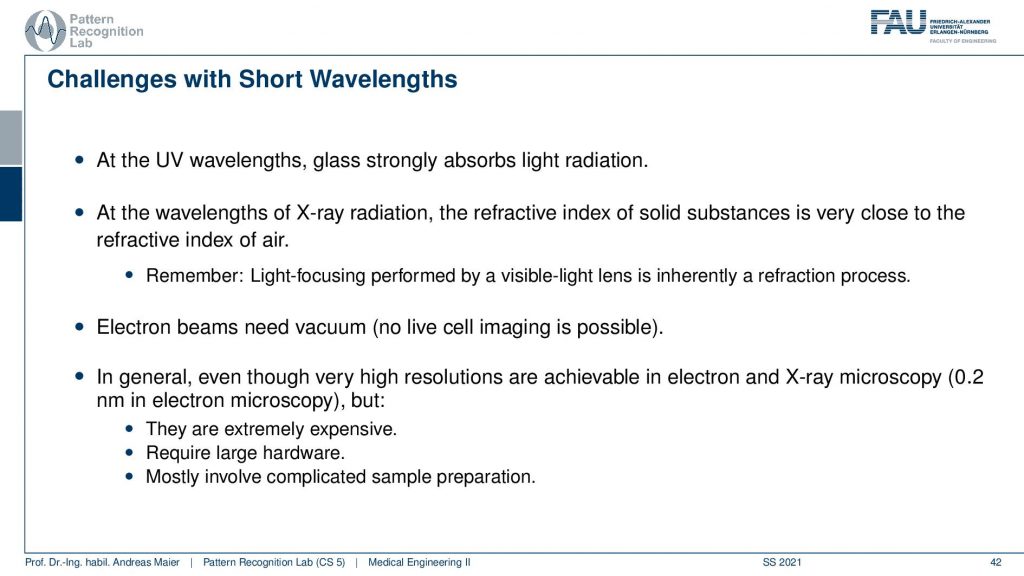
There are ultraviolet light wavelengths but they are absorbed very strongly in the glass. So glass is almost completely absorbing ultraviolet light. So that’s a problem. Then at the wavelengths of radiation of x-ray radiation then the refractive index of solid substances is very close to the refractive index of air. So you don’t get any refraction anymore which means that the classical lens systems don’t work in this kind of environment. So there we will have problems with building classical lenses and we can’t use the lenses that we discussed in the first part of the video here. So this is inherently a refraction process and the problem with x-rays is that they basically don’t reflect. So you don’t have the classical lens systems. There are approaches to do this with x-ray lenses and so on but we also don’t discuss them in this video here. Well, electron beams need a vacuum. So there’s no living cell imaging possible and also no living specimen. So in general it is very tough to image at very high resolutions and this is then done in electron and x-ray microscopy. But it’s very expensive it requires really large hardware and mostly involves complicated sample preparation. Because you have to make sure that you can actually image the sample and don’t destroy it with the high energies that are involved in the radiation that you’re using.
Well, there are some future trends that try to circumvent that. There is light microscopy is of course very practical in comparison to electron microscopy. But of course, it doesn’t have as high magnification. So the question is can we actually beat this physical limit with light microscopy? There is an approach that is called super-resolution microscopy and this actually can beat the physical diffraction limit of light. This is also something that we discuss in the coursebook. So if you’re interested in that have a look at the script and I can definitely recommend reading it. So this is actually the Nobel prize that was awarded to Stefan Hell in chemistry in 2014 for the discovery of STED(stimulated emission depletion) microscopy. This is a super-resolution technique that overcomes the diffraction limit of visible light. So it’s a very cool technique and I can recommend having a look at it in our coursebook.
So this brings us already to the end of our lecture and here I have again the reference to our coursebook and this concludes our excursion into light microscopy.
So what’s up next in the next lecture? We will start looking into three-dimensional modalities and this is done using magnetic resonance imaging. So this is MR imaging and here we will discuss how to actually get the image. Why it’s very different from what we’ve seen so far? We’ll see that a very good old friend that we discovered earlier in this course, the Fourier transform will help us actually to get those images. So I hope you enjoyed this little video and found it quite instructive. I’m very much looking forward to seeing you at the next one. Thank you very much for watching and bye-bye!!
If you liked this post, you can find more essays here, more educational material on Machine Learning here, or have a look at our Deep Learning Lecture. I would also appreciate a follow on YouTube, Twitter, Facebook, or LinkedIn in case you want to be informed about more essays, videos, and research in the future. This article is released under the Creative Commons 4.0 Attribution License and can be reprinted and modified if referenced. If you are interested in generating transcripts from video lectures try AutoBlog
References
- Maier, A., Steidl, S., Christlein, V., Hornegger, J. Medical Imaging Systems – An Introductory Guide, Springer, Cham, 2018, ISBN 978-3-319-96520-8, Open Access at Springer Link
Video References
- How Does Fluorescence work? https://youtu.be/FZ9E5hZMbCA
- Fluorescence microscopes are amazing https://youtu.be/iYoAiqufB7w
- What PHASE CONTRAST microscopy is – all you ever wanted to know https://youtu.be/HBP6SWZrilw
- The Basics of Diffraction and Airy Disks https://youtu.be/MItl-ins56w
- Comparison of confocal and STED images of live human fibroblast interphase nuclei https://youtu.be/-HW1DlqS6cI