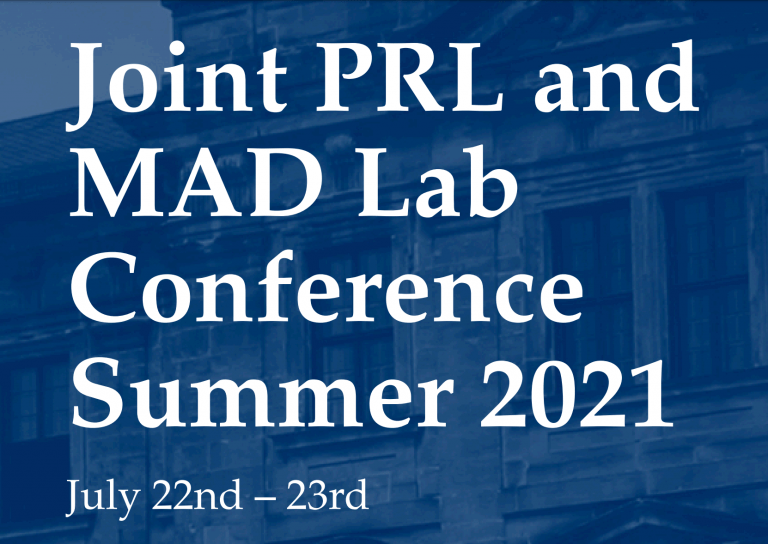
Index
Convolutional LSTM for Multi-organ Segmentation on CT and MR Images in Abdominal Region
Improving Instance Localization for Object Detection Pretraining
Detecting workflow-states of an MR examination using semantic segmentation of synthetic 3D point-clouds
Future medical scanners will become more autonomous and situation-aware (scene understanding). Intelligent algorithms for scene understanding need data to be trained and if possible, this data needs to be available early in the development process. Synthetic data can be valuable for this purpose.
The data used in this thesis is generated by making use of Augmented Reality (AR) glasses and RGB-D sensors. The user of the AR glasses runs a virtual MR examination while being recorded by a system of RGB-D sensors. The system that the user operates in AR is a digital twin of a real MR scanner [1]. The user manipulates coils, cushions, headphones, and any other required accessory and interacts with an avatar of a patient. Virtual 3D point clouds are generated from the AR scene and real 3D point clouds are recorded with the RGB-D sensors. These point cloud data sets are later fused resulting in a synthetic 3D depth data set of the whole MR examination scene.
The aim of this thesis is to develop and train algorithms for scene understanding and analysis based on these synthetic data sets. Firstly, semantic segmentation of the synthetic 3D point clouds using deep learning techniques shall be applied, and scene descriptors shall be designed and developed. Goal is to detect the elements of the provided scenes (e.g. operator, patient, magnet, coils, etc.) in synthetic and
real world data. The network will be trained using synthetic 3D data (3D point clouds). Moreover, synthetic 3D data as well as real 3D data from a real system will be used for testing the approach. As a reference, the work of Nie et al [2] will be used.
This thesis shall furthermore discuss how workflow state detectors can be designed to detect the different states of an MR examination (e.g. idle, patient preparation, coil fixation) based on the results of the semantic segmentation, scene description.
Finally, a discussion about the usefulness, advantages, and challenges of synthetic data will be provided.
[1] MAGNETOM Free.Max. Siemens Healthineers; https://www.siemens-healthineers.com/magnetic-resonance-imaging/high-v-mri/magnetom-free-max
[2] Nie, Yinyu & Hou, Ji & Han, Xiaoguang & Niesner, Matthias. (2021). RfD-Net: Point Scene Understanding by Semantic Instance Reconstruction. 4606-4616. 10.1109/CVPR46437.2021.00458.
Automatic Pathological Speech Intelligibility Assessment Using Speech Disentanglement Without Bottleneck Information
DL-based 3D co-registration of data with strongly varying contrast — applied to CEST MRI
T2 Distribution Analysis of Inflamed Bone Marrow Compartments in MR Images with Quantitative T2-mapping
Matrix Operations for Applications in Quantum Annealing
Motivation:
Quantum annealing is a promising technology for quantum
computing to solve quadratic problems. D Wave makes
quantum annealers and provides an open source Python
interface: Ocean [1]. Ocean’s hybrid models do not yet
support matrix problem formulations. Current approaches are
based on SymPy [ 2]–> slow for matrix problems
Goal:
•
Speed up matrix operations for problem formulations
References:
[1] https://docs.ocean.dwavesys.com/
[2] https://www.sympy.org/
Development of a comprehensive SPECT phantom dataset using Monte Carlo Simulation
Background
Single Photon Emission Computed Tomography (SPECT) [1] is a medical imaging technique used
to study the biological function and detection of various diseases in humans and animals. Due
to the low amount of radioactivity typically used in SPECT scans, we have a lot of noise in our
SPECT acquired images, and because it is an inverse problem we do not have an exact ground truth.
For this reason we simulate objects with numerical ground truth, that will be used to create our
simulated dataset. The created dataset can then be used to train a Neural Network, analyze noise,
test multiple reconstruction techniques or evaluate the effects of acquisition geometry.
The objective of this research laboratory is to generate a large dataset of SPECT images, that will
be useful in the applications of deep learning in medical image processing.
Methods
We simulate 100 phantoms with different shapes and properties e.g. attenuation and activity maps.
Simulating simple geometric phantoms such as spheres, cubes and cylinders is the first step of
this research laboratory. In the following step we generate alphabetic letters phantoms. Last we
simulate more realistic physical phantoms like the Shepp-Logan or XCAT phantoms. To simulate
measurements of these phantoms, we use SIMIND, a Monte Carlo based simulation program [2].
SIMIND can describe different scintillation cameras, that can be used to obtain sets of projection
images of the simulated phantom. SIMIND allows the adjustment of different acquisition parameters
e.g. photon energy, number of projections, detector size, energy resolution, allowing the creation of a
comprehensive database of SPECT acquisitions in terms of geometry, and acquisition configuration.
After postprocessing the projection data, we obtain the reconstructed 3D images from the data by
applying iterative reconstruction techniques like Ordered Subset Expectation Maximization (OSEM)
and Ordered Subset Conjugate Gradient Minimization (OSCGM).
Expected Results
At the end of this research laboratory, the student shall have a deeper knowledge of Monte Carlo
Simulation (MCS) and reconstruction for SPECT imaging. Further, the student shall have created
a dataset that will be available for future projects, including denoising, reconstruction and other
image processing related tasks. Additionally, the student shall summarize their findings in a short
report and write a documentation about the database and how to use it.
References
[1] Miles N Wernick and John N Aarsvold. Emission tomography: the fundamentals of PET and
SPECT. Elsevier, 2004.
[2] Michael Ljungberg and Sven-Erik Strand. A monte carlo program for the simulation of scintillation
camera characteristics. Computer methods and programs in biomedicine, 29(4):257–272,
1989.
A Review of Diagnosis Rheumatoid Arthritis, with Evaluating Parameters of Micro-CT Scanner and Laboratory Measurements
Continuous Non-Invasive Blood Pressure Measurement Using 60GHz-Radar – A Feasibility Study
Hypertension – high blood pressure (BP) – is known to be a silent killer. Untreated, it can cause
severe damage to the human’s organs, mainly to the heart and kidneys [5, 6]. BP is
usually classified by using the highest – systolic – and the lowest – diastolic – pressures during one
cardiac cycle [2]. The gold standard for measuring BP remains the oscillometric method,
which is employed in traditional arm-cuffs [4]. This method, however, suffers from extensive
deficiencies: Discomfort leads to unreliable measures [2]. Additionally, it only captures
the static status of the very dynamic arterial BP and thus loses important variation information,
leading to poor time resolution [2, 3, 4, 7] However, there is a strong
need for continuous beat-to-beat BP readings [4], as they are more reliable predictors of
aforementioned cardiovascular risks than single readings [1].
The goal of this master thesis is to show whether it is feasible to use a 60GHz radar device to
continuously estimate BP. Radar is chosen as it has a very small form factor and very low power
consumption – both being favorable characteristics for integrating into a wearable device. The
radar is put into an 3D-printed enclosure which is fastened to the left wrist using a velcro strap. It
is capable of extracting the skin displacement caused by the expansion of the underlying artery,
which is localized using a beamforming algorithm. The extracted skin displacement contains the
pulse waveforms which are used for extracting the BP.
In literature, mainly two methods have been used to design continuous BP devices. One is based
on Pulse-Wave-Velocity, and in that context also Pulse-Transit-Time, the other is based on Pulse-
Wave-Analysis [4]. Since the first method depends on the usage of an electrocardiograph,
this method was not employed in this work, as the goal is to implement a stand-alone solution
which does not require additional devices. Therefore, the second method is implemented.
For that, the extracted skin displacement is split into individual pulse waveforms. Each is used
as input for a support vector machine, that decides whether it is good enough as an input for the
neural network, such that only sufficiently good waveforms are used. Then, 21 distinctive features
are extracted for the individual good waveforms. These features, together with the calibration
parameters gender, age, height and weight, are used as features for a neural network. The network
is then used to predict systolic and diastolic values.
It is expected that some correlation between the skin displacement, captured by the radar, and
the corresponding BP will become apparent, allowing for future research to further improve the
accuracy.
References
[1] D. Buxi, J.-M. Redout´e, and M. R. Yuce. Blood pressure estimation using pulse
transit time from bioimpedance and continuous wave radar. IEEE Transactions on
Biomedical Engineering, 64(4):917–927, 2016.
[2] Y. Kurylyak, F. Lamonaca, and D. Grimaldi. A neural network-based method for
continuous blood pressure estimation from a ppg signal. In 2013 IEEE International
instrumentation and measurement technology conference (I2MTC).
IEEE, 2013.
[3] M. Proenc¸a, G. Bonnier, D. Ferrario, C. Verjus, and M. Lemay. Ppg-based blood
pressure monitoring by pulse wave analysis: calibration parameters are stable for three
months. In 2019 41st Annual International Conference of the IEEE Engineering in
Medicine and Biology Society (EMBC), pages 5560–5563. IEEE, 2019.
[4] J. Sol`a and R. Delgado-Gonzalo. The handbook of cuffless blood pressure monitoring.
Springer. Available online at: https://link. springer. com/book/10, 1007:978–3, 2019.
[5] WHO. Hypertension.World Health Organization. URL: https://www.who.int/
news-room/fact-sheets/detail/hypertension.
[6] X. Xing, Z. Ma, M. Zhang, Y. Zhou, W. Dong, and M. Song. An unobtrusive and
calibration-free blood pressure estimation method using photoplethysmography and
biometrics. Scientific reports, 9(1):1–8, 2019.
[7] Y. Yoon, J. H. Cho, and G. Yoon. Non-constrained blood pressure monitoring using
ecg and ppg for personal healthcare. Journal of medical systems, 33(4):261–266, 2009.