NewsWelcome to the Summer Term 2026 at the Pattern Recognition Lab
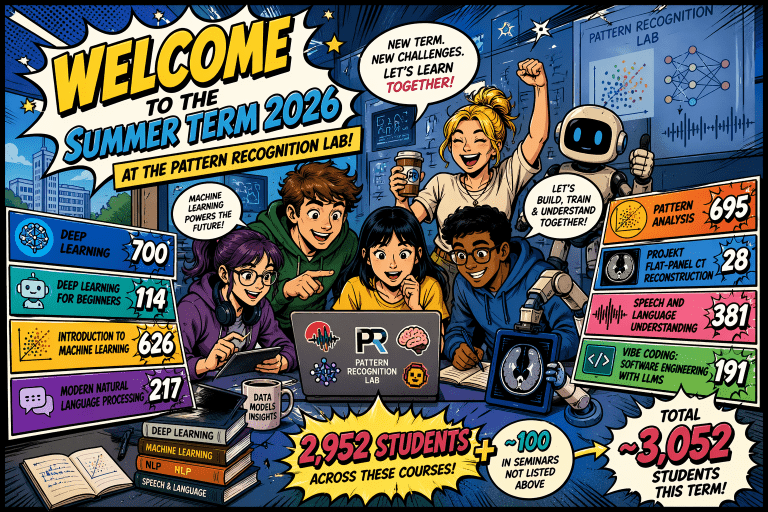
The Pattern Recognition Lab is delighted to welcome students to the summer term 2026. Once again, the strong interest in our courses highlights the continued enthusiasm for machine learning, artificial intelligence, language technologies, medical imaging, and modern software development across our student community. This summer, 700 students enrolled in Deep Learning, while Deep Learning for Beginners attracted 114 […]The Pattern Recognition Lab is delighted to welcome students to the summer term 2026. Once again, the strong interest in our courses highlights the continued enthusiasm for machine learning, artificial intelligence, language technologies, medical imaging, and modern software development across our student community. This summer, 700 students enrolled in Deep Learning, while Deep Learning for Beginners attracted 114 […]